
This article explains steps necessary to work around an issue that presents after installing a new version of Grafana through Debian OS Updates.
Problem
Grafana Statistics displays N/A or "Error updating options: origin not allowed" after Debian OS updates are applied.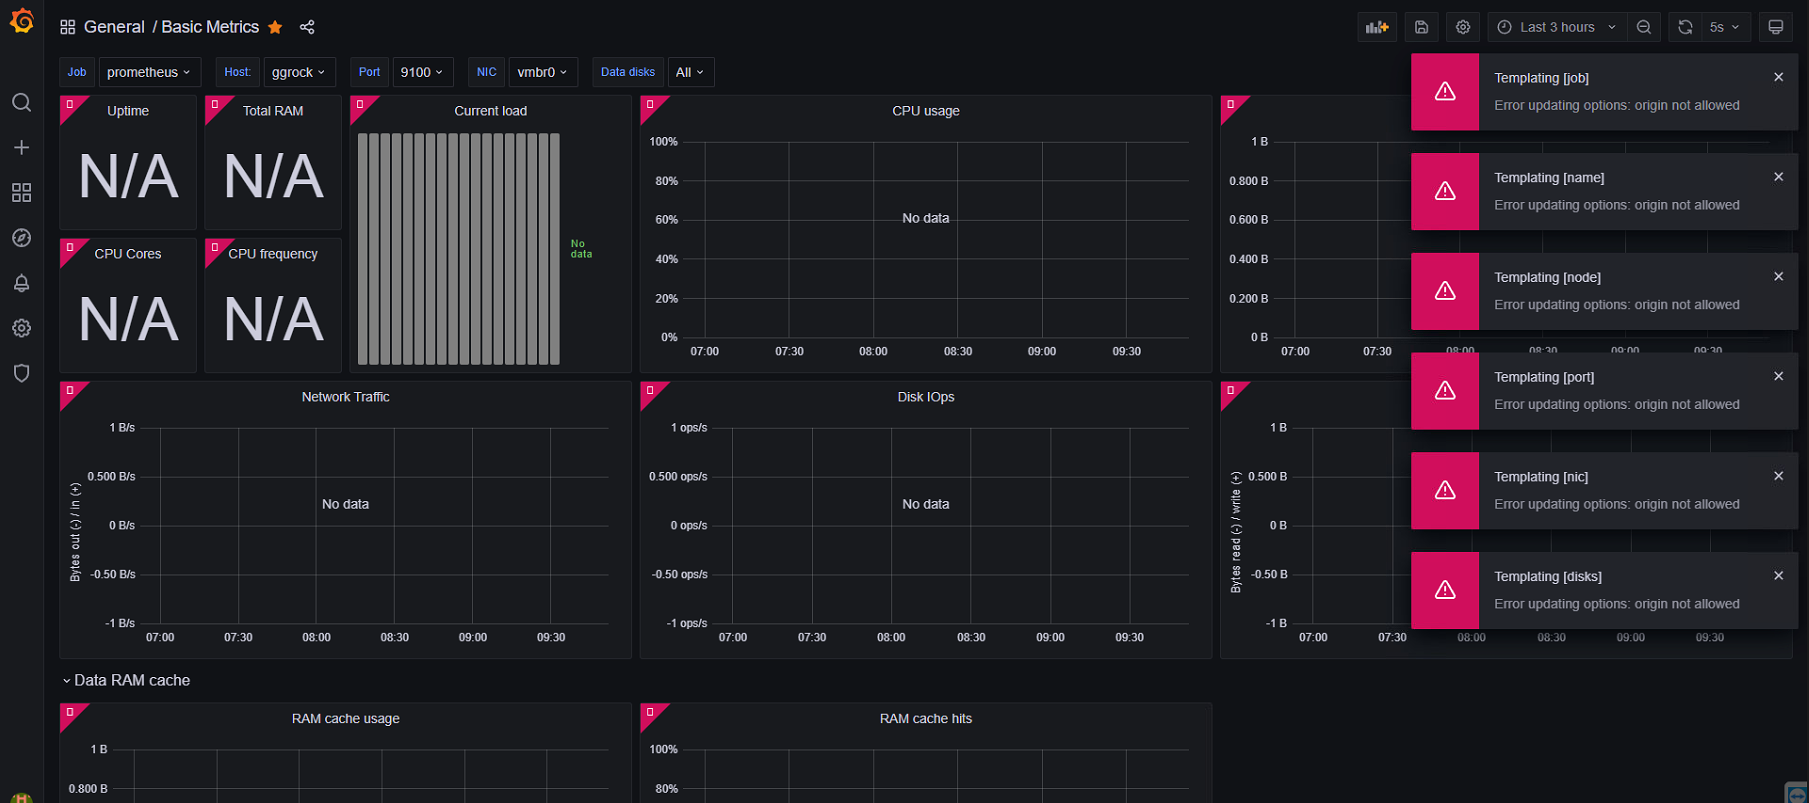
Solution 1
1. Access the server console via a direct connection to the server, SSH, or via Debian Control Panel.
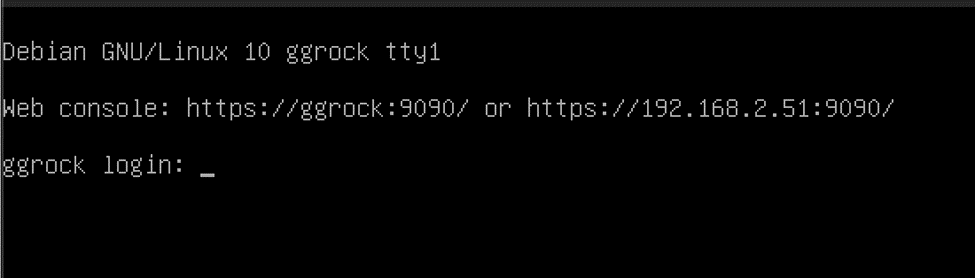
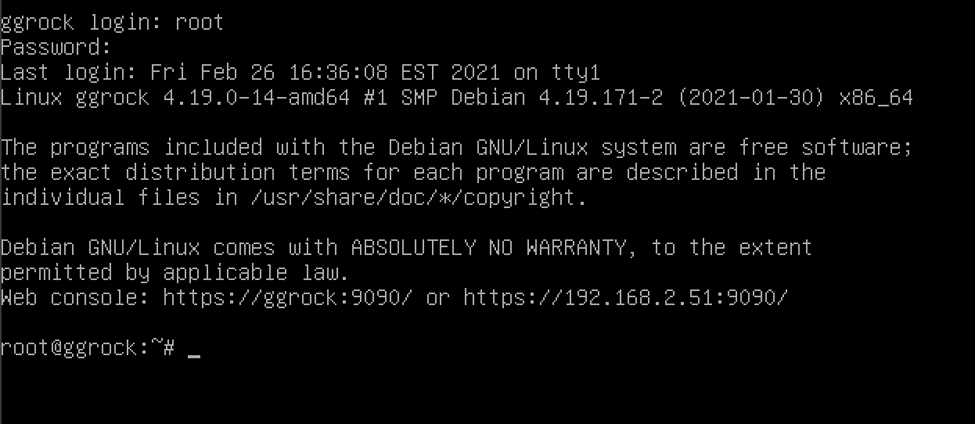
2. Log in with the root user, or another admin user on the system.
3. Back up the ggRock nginx configuration file:
cp /etc/nginx/conf.d/ggrock.conf /etc/nginx/conf.d/ggrock.conf.bak
4. Open the ggRock nginx configuration file in a text editor:
nano /etc/nginx/conf.d/ggrock.conf
5. Using the arrow keys on the keyboard, navigate down to the grafana configuration section
6. Add a new line with the following content:
proxy_set_header Host $http_host;
After the file has been modified, the requisite section should appear as in the below screenshot:
 7. Press <CTRL> + 'X' on the keyboard to save and write the file, pressing the 'Y' key to confirm and save changes.
8. Restart the nginx proxy service using the following command:
systemctl restart nginx.service
9. Wait 10-20 seconds for service restart to occur, then refresh the Grafana web interface to display statistics.
** Thanks to our friends at Fortress Melbourne for this solution!
Solution 2
1. Access the server console via a direct connection to the server, SSH, or via Debian Control Panel.
2. Log in with the root user, or another admin user on the system.
3. Issue the following two commands to install an older known-good version of grafana:
wget https://dl.grafana.com/enterprise/release/grafana-enterprise_8.3.3_amd64.deb

dpkg -i grafana-enterprise_8.3.3_amd64.deb
4. Reboot the server and access the Grafana web interface to display statistics.